Frost on the way?
See frost risk for the next 48 hours and the expected minimum. Know which field to watch first.
Frost alerts in practice
WEATHER FOR YOUR OWN FIELDS
Tell us what you want to do — we’ll say when and where. Frost, irrigation and spray on a 3D model of your own field with real terrain.
Completely free · Try it without signing in
THE Meteon 3D MODEL
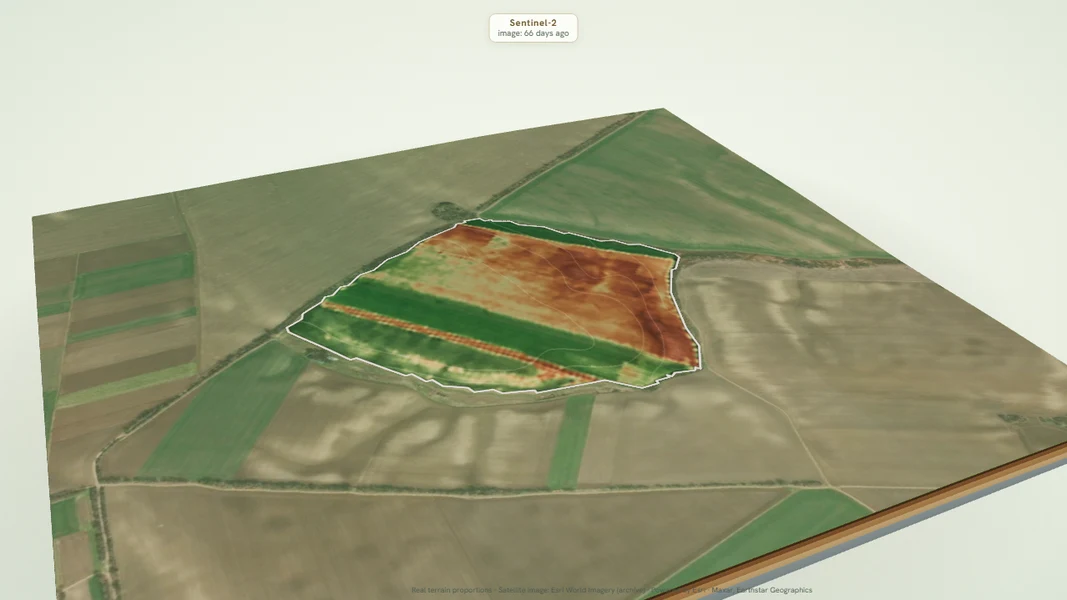
Your drawn field appears as a rotatable 3D model with real terrain. Each view answers one question; forecast views play forward on a timeline. The images below come from the live app.
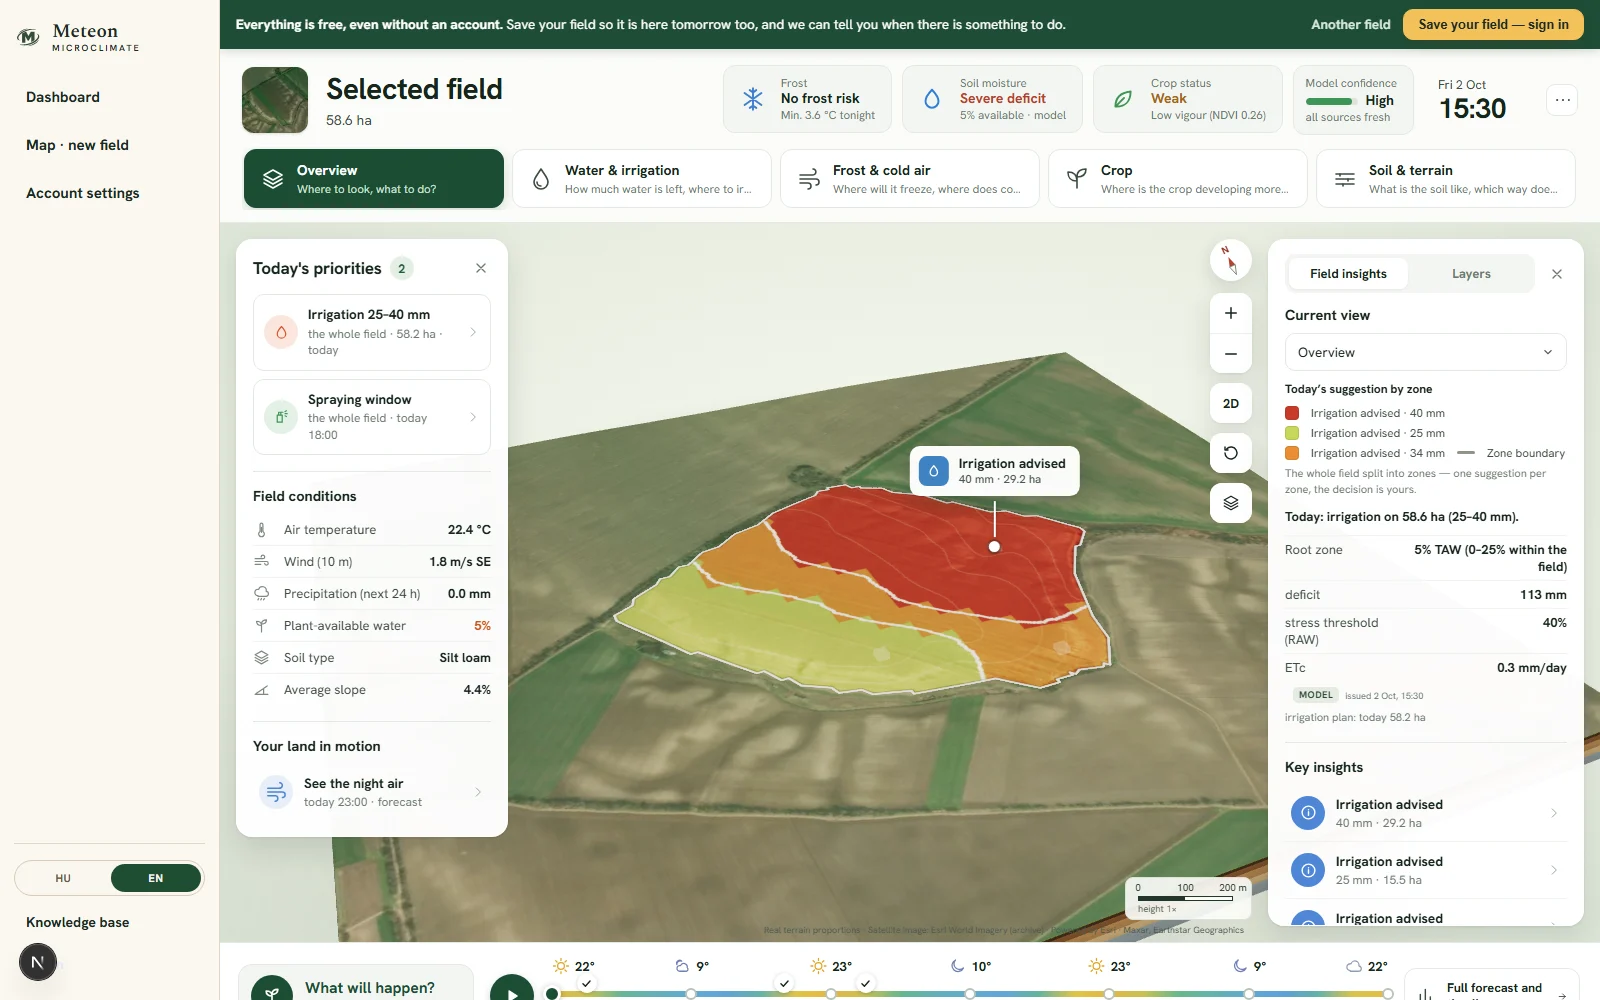 OverviewFull app screen ↗ ↗Colour = today’s suggestion · white line = zone boundary
THE FIELD AT A GLANCE
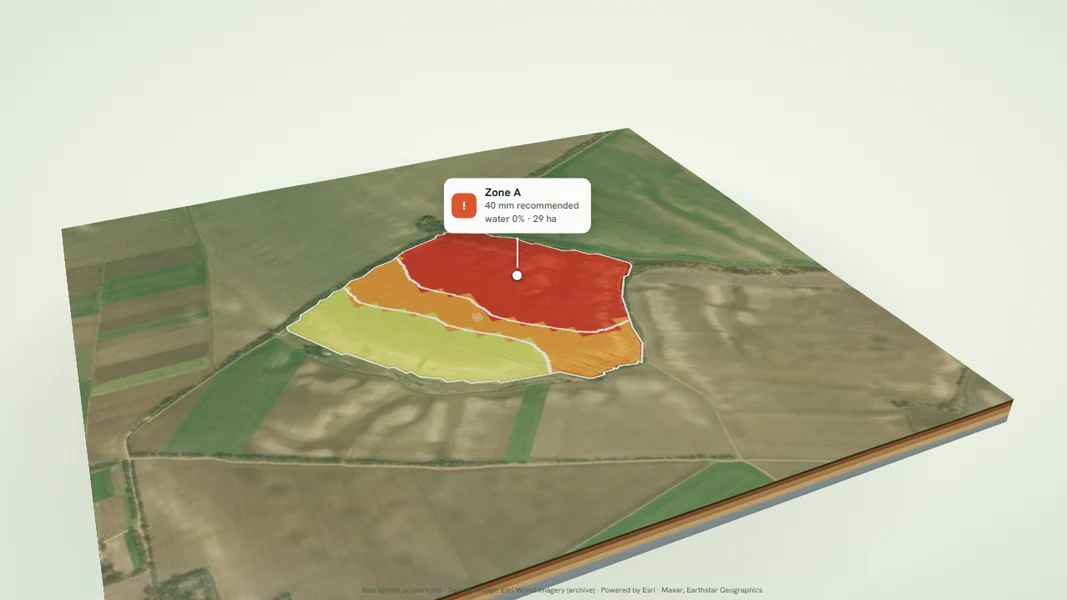
Overview splits the whole field into zones and gives each one suggestion for today: where irrigation is worth it, where frost protection is needed, where to take a look — and where there is nothing to do.
Real app views on a real field in Tolna, Hungary. On your own field the estimates are built from the data available for it.
LESS GUESSWORK IN THE FIELD
Alongside the 3D model you get weather, crop signals and upcoming tasks — all tied to the field you select.
See frost risk for the next 48 hours and the expected minimum. Know which field to watch first.
Frost alerts in practiceWind, rain and temperature highlight windows to help you plan applications.
See the spray windowView estimated soil water deficit together with expected rain so you can decide on irrigation with more context.
How the water balance looksSatellite views highlight differing patches. With capture date you see which areas to walk first.
Crop status on the mapTasks gathers signals that need attention. On the 3D model you see which parts of the field they relate to.
From alert to taskWHAT YOU SEE IN THE APP
Frost alerts, weather, water balance and satellite maps in one place. The images below come from the current app, on a real field.
Without an account, free — with every feature.
Mark the boundary on the map.
Save it and follow along on the dashboard.
01 / FROST RISK
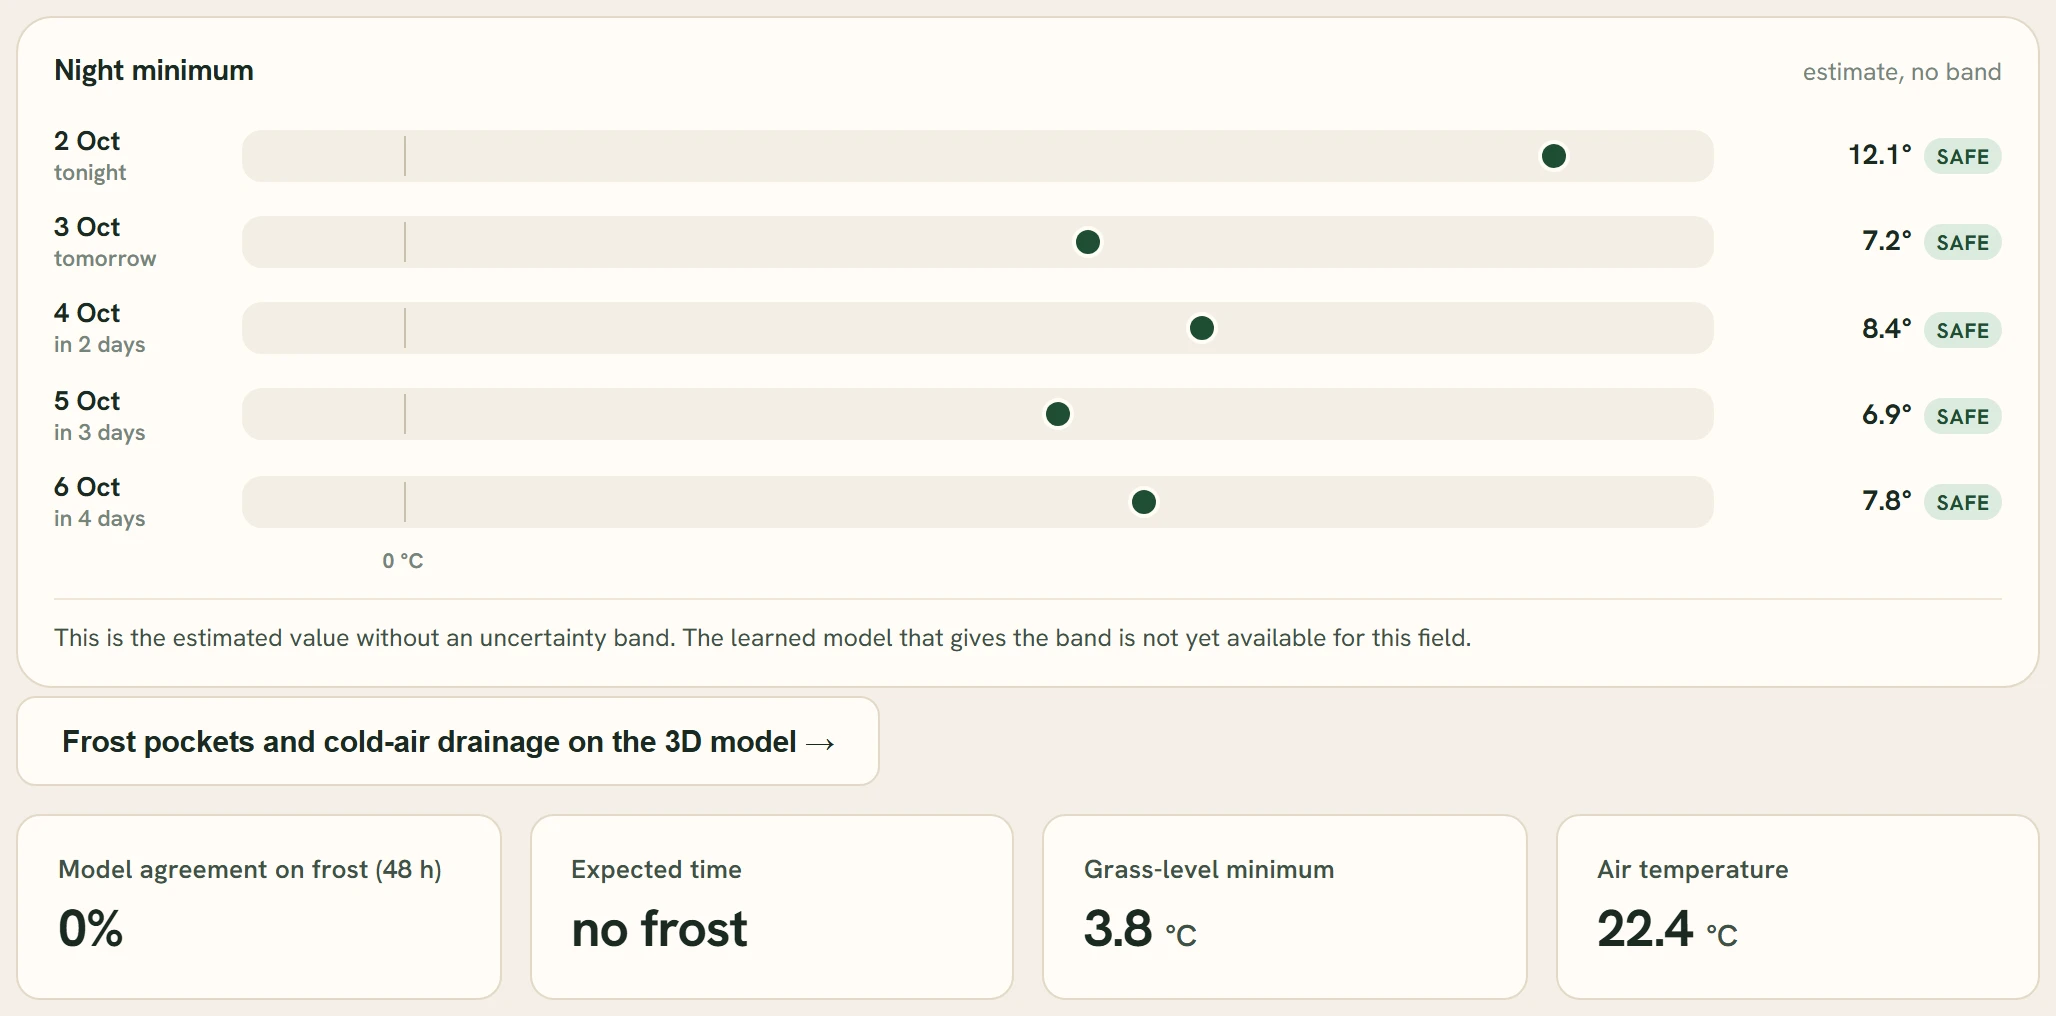
Alongside the frost alert you see the expected minimum and why risk is elevated — so you can weigh frost protection in time.
02 / THE NEXT DAYS
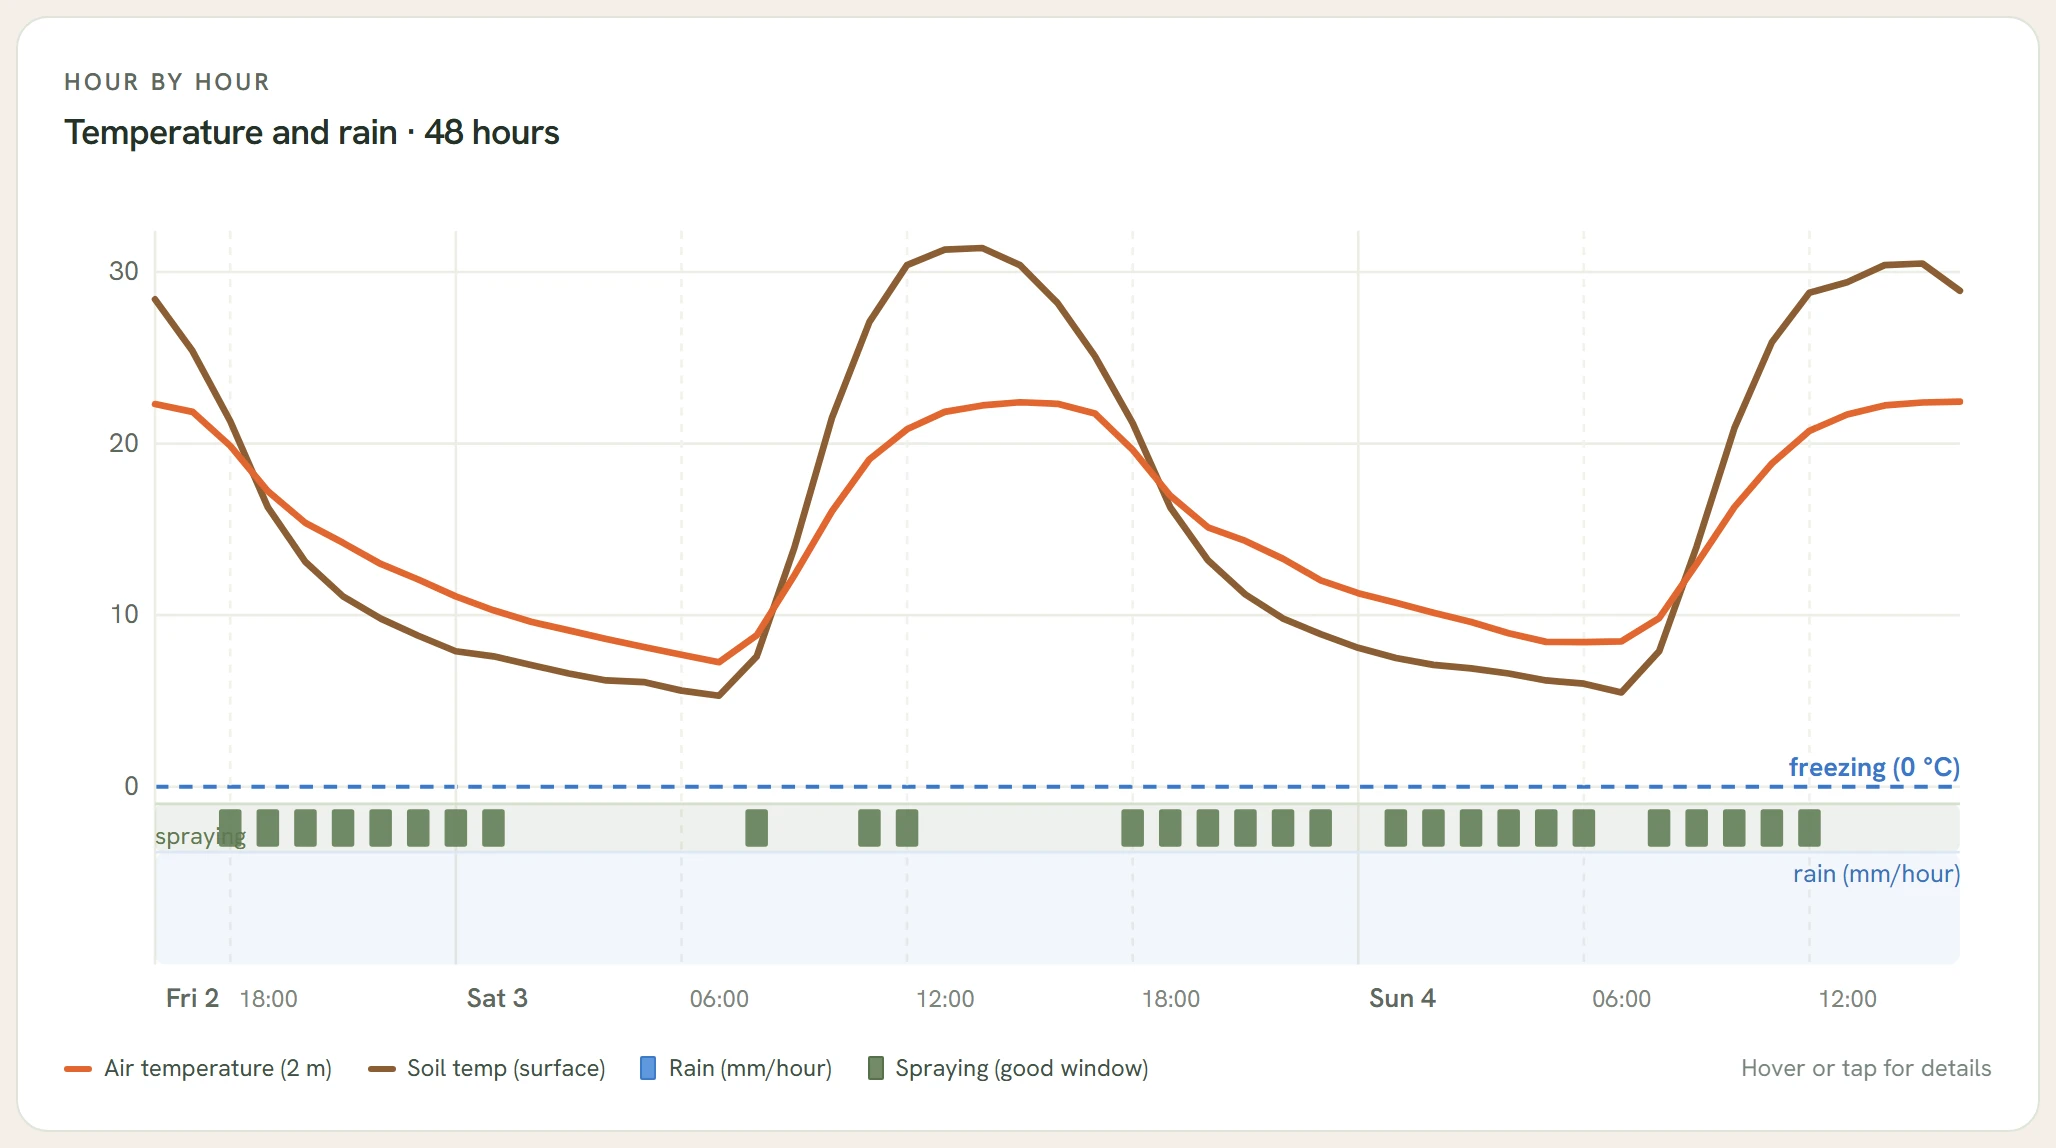
Temperature, precipitation and spray-suitable hours on one chart. See at a glance which part of the day is worth heading out.
03 / IRRIGATION WATER BALANCE
The system shows estimated deficit and expected rain in millimetres. Log irrigation you apply in the same place.
04 / NDVI MAP
The satellite vegetation map shows in-field variation. Pick which patch to walk and inspect up close.
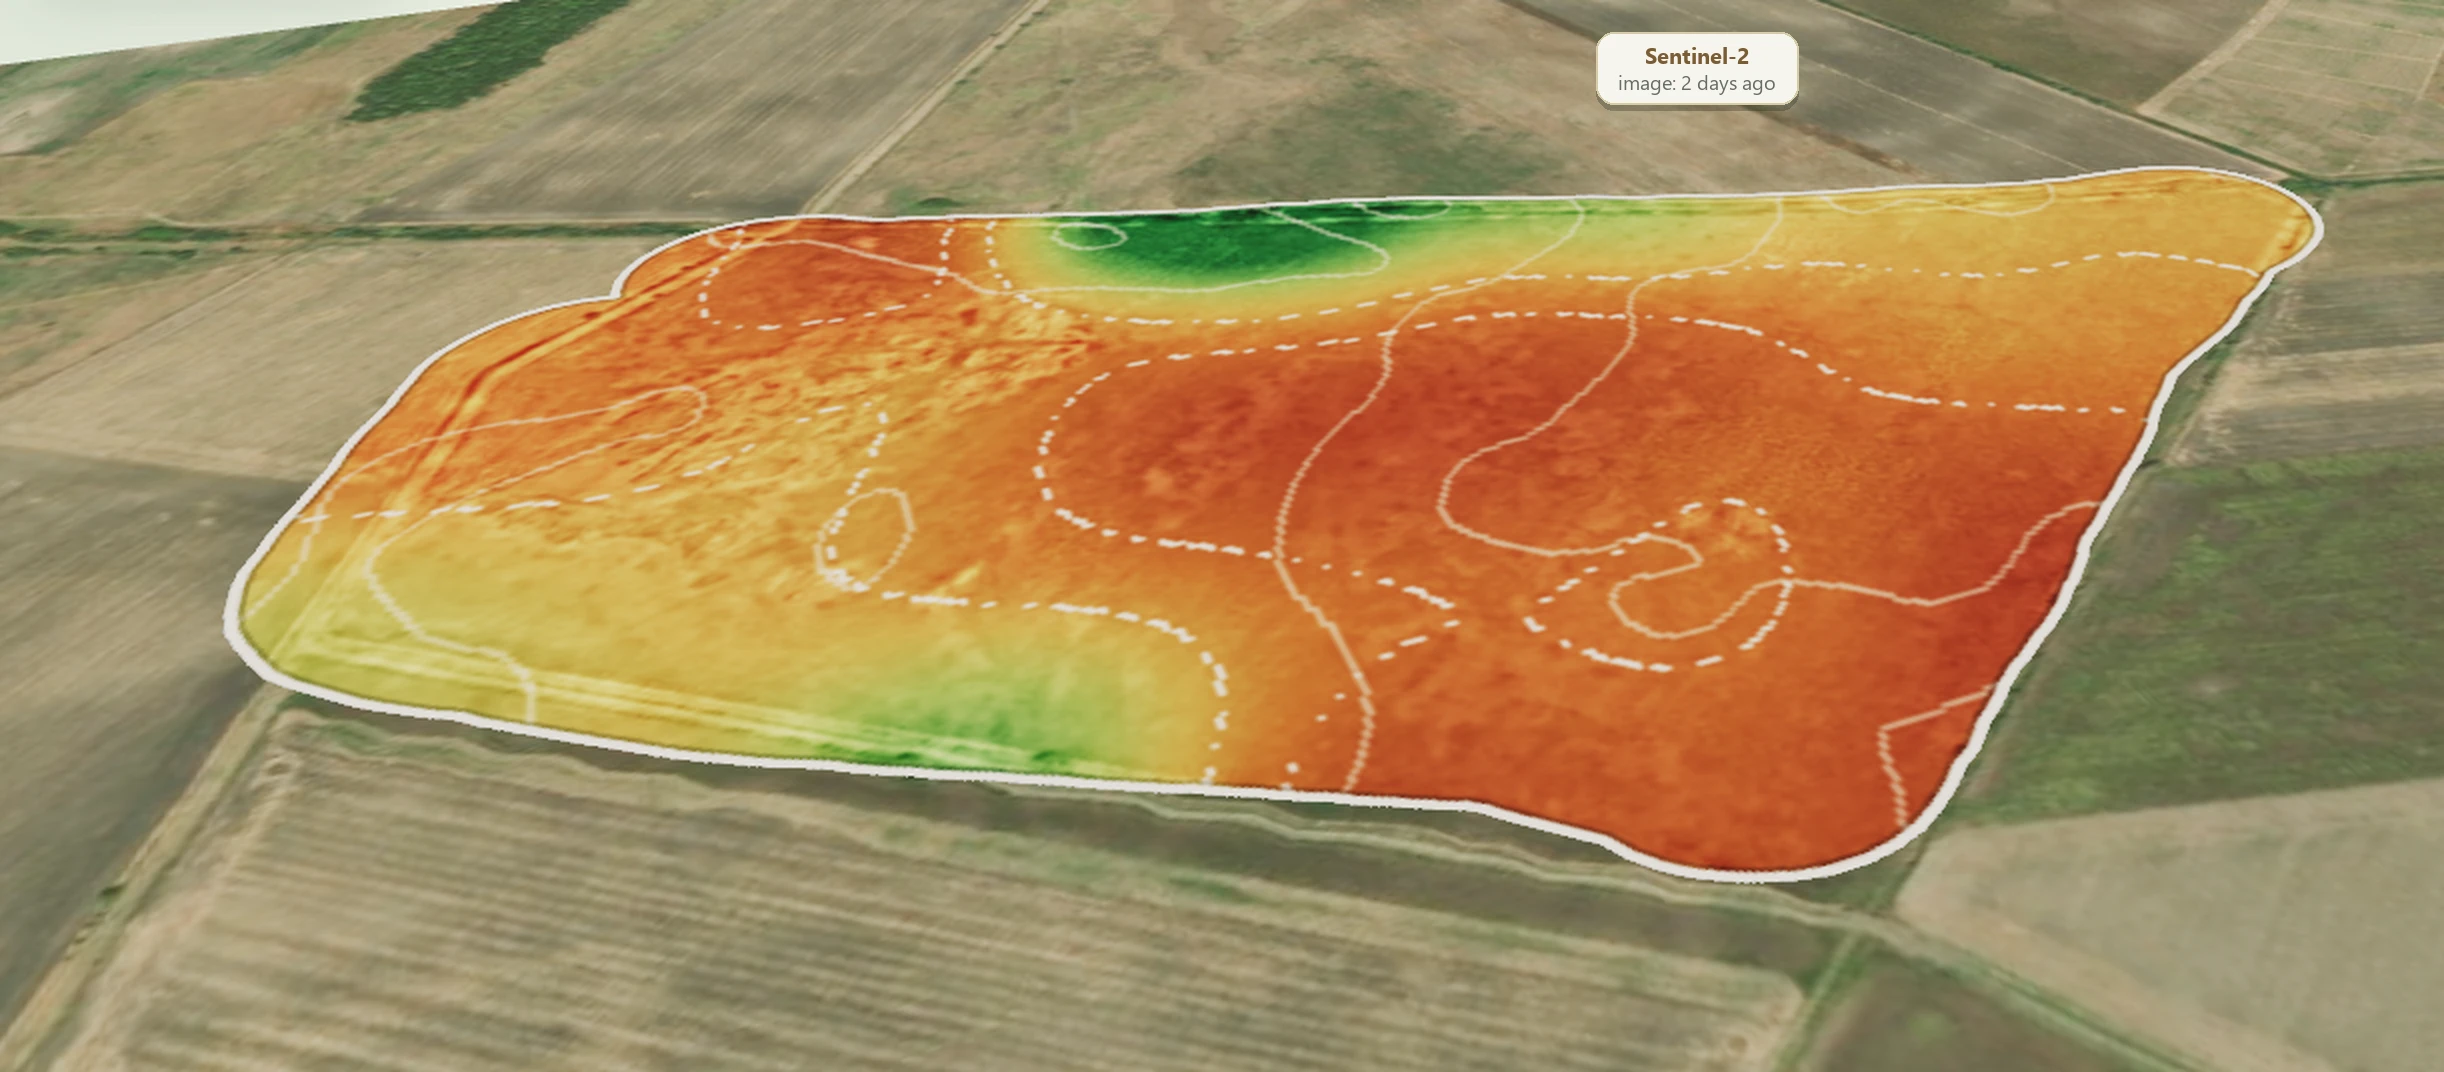
05 / ESTIMATED YIELD MAP
Yield estimation shows where production may be stronger or weaker within the field, relating satellite pattern to expected average yield.
Modelled estimate, not combine-measured yield. White areas have no usable data.
FROST DETECTION VALIDATION
We tested spring frost detection against Hungarian weather station measurements using historical weather data.
Frost and temperature values shown for your field are model estimates, not on-site measurements.
How does the model calculate?of spring frost days detected in the historical test — 635 frost days, 36 Hungarian stations
mean error vs measured temperature — 82,046 hours, 10 Hungarian stations
GOOD TO KNOW BEFORE YOU START
Draw your land, set the crop, and the system connects the data available for it.
Meteon works without installing your own sensors. It builds on weather, satellite, terrain and soil data; you can log field observations in the Log.
We tie terrain, satellite observations and weather to your drawn boundary. Crop and sowing data help interpret status and tasks.
Satellite views come from imagery; water and processes are modelled estimates. Views show source, capture time or forecast time. Frost hollow tendency, for example, is not locally measured temperature.
Everything. During the beta every feature is free, and you can view your own field without signing in. You only need an account to save the field.
