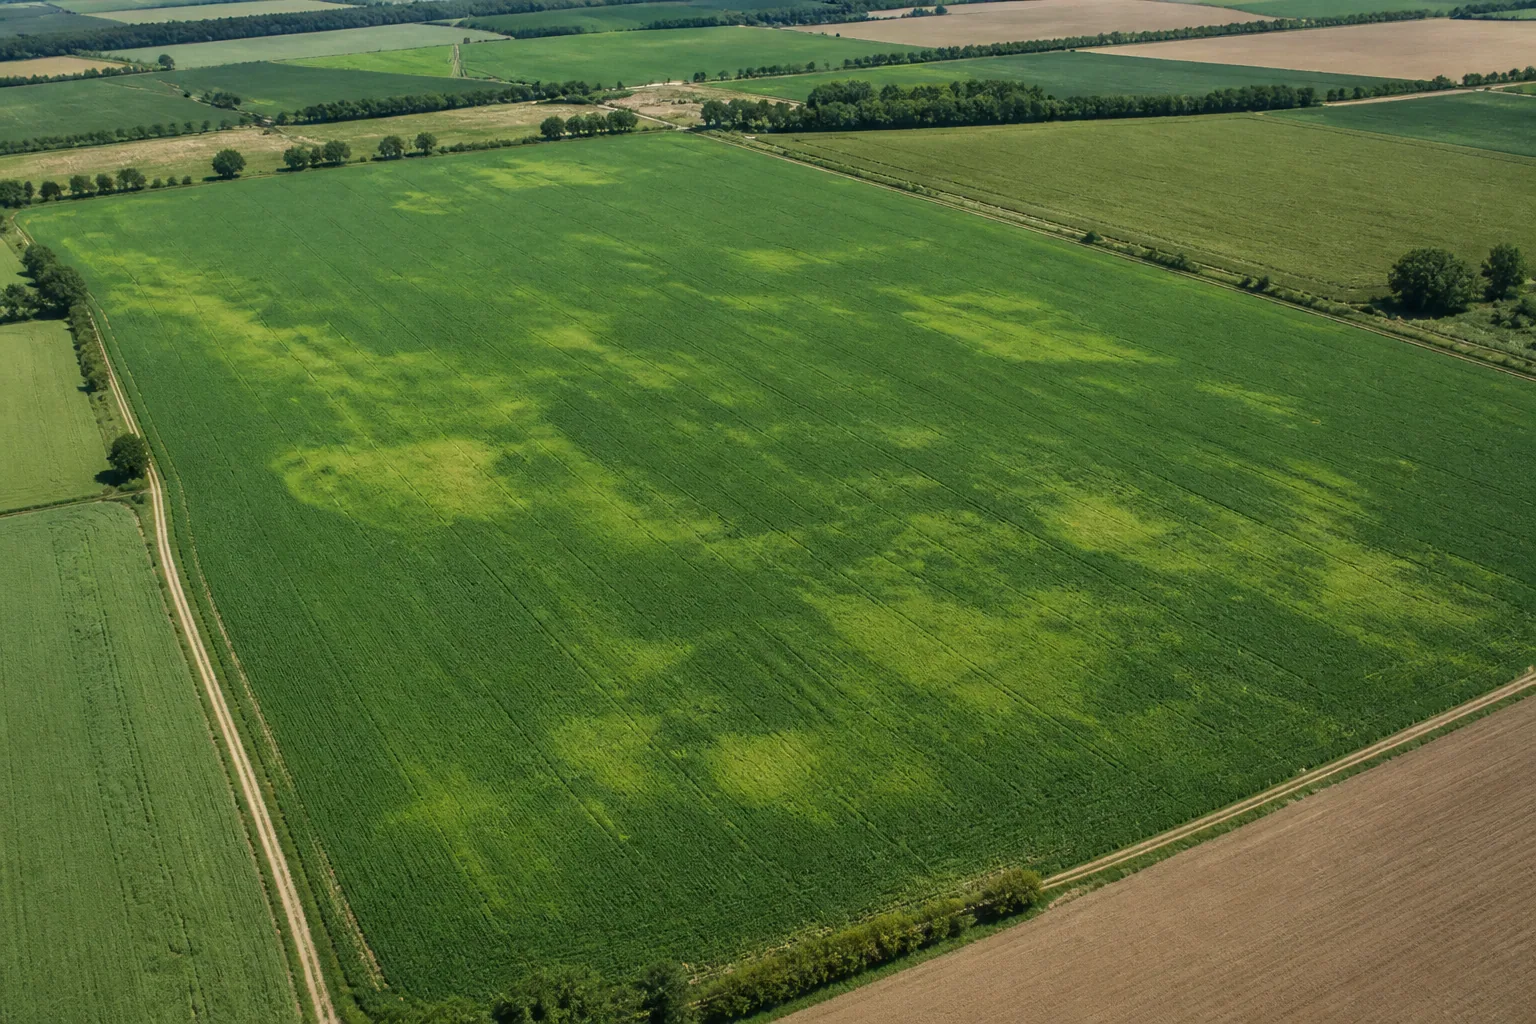
In short: NDVI shows how much red and near-infrared reflectance of vegetation differs. Its greatest value is not that it "qualifies" the plant with a single number, but how shows where and when the stock changed. Based on this, it is possible to walk around and pattern the field in a more targeted manner.
What does NDVI actually measure?
A healthy green leaf absorbs a significant amount of red light for photosynthesis, but reflects much of the near-infrared range. NDVI normalizes the difference between these two spectral bands:
NDVI = (Near Infrared − Red) / (Near Infrared + Red)
In theory, the result is between −1 and +1. Water, clouds or snow are often low or negative, bare ground is mostly low positive, closed and active green vegetation gives a higher value. However, these are not universal diagnostic limits.
The comparison is more important than the absolute number
A value of 0.65 alone does not say much. The same number can mean something different in a newly closed corn, a rarer plantation or a ripening grain. It is more useful to make three types of comparisons:
- Within a field: which spots differ from the typical state of the field on the same day?
- In time: is the same zone improving, stagnating or deteriorating faster than its surroundings?
- Among similar fields: with the same crop, sowing time and phenological condition, is there a lasting difference?
For all three, only work with comparable recordings. Clouds, fog, shadows, different sensors or processing can cause artificial changes.
Five-step workflow for field walkthrough
- Check the date and quality of the image. An old or partially cloudy image does not describe the current state.
- Look for the spot, not just the bare minimum. A coherent deviation related to the cultivation direction or topography gives more information than a single defective pixel.
- Look at the history. Is it newly formed, is it spreading gradually, or does it appear in the same place year after year?
- Mark control point. Don't just cover the weak spot; also examine a nearby normal part using the same method.
- Look for the reason in the field. Check plant number, development status, leaf color, root, soil moisture, compaction, pest and disease symptoms. Only then decide on intervention.
What makes NDVI lower?
The index indicates a symptom, it does not separate the causes. The same pattern can be created by several opposite states:
- lack of water or permanent water cover and lack of oxygen;
- lack of nutrients, unfavorable pH or poor root development;
- lack of emergence, frost damage, ice damage, wild damage or trampling;
- fungus, pest or weed infestation;
- different soil type, compaction, erosion or shallow topsoil;
- phenological variation, ripening, mowing or harvesting;
- cloud, shadow, fog or faulty pixel mask.
When is it less reliable?
In early stock
When there is still a lot of soil between the rows, the color and moisture of the soil have a strong influence on the value. In such cases, the number of occurrences and the on-site inspection may be more important.
With very dense, closed foliage
With a high leaf area, NDVI can become saturated: it shows the difference between two equally strong stands less sensitively. In such cases, another index — for example, the NDRE using the red edge band — can complete the picture.
During cloudy periods
An optical satellite cannot see through the cloud. The recording frequency is not the same as the frequency of usable images, so the date of the image must always be shown and checked.
This way, the NDVI becomes a better decision
Link the index with data on precipitation, soil moisture water deficit, heat stress, topography and soil properties. If a weakening spot appears in a water-scarce zone, at a higher elevation, you start the field with a different hypothesis than if a permanent excess of water appears in the same area after rainfall. More data does not trigger an inspection; it helps you ask a better question.
FAQ
What is a good NDVI value?
There is no good value for all crops and times. The state of development, stock density, soil background and time of measurement are strongly influenced. First of all, compare the zones and time series of the same field measured in a similar phenological state.
Does low NDVI surely mean water shortage?
Not. It can also be caused by lack of germination, lack of nutrients, disease, pest, internal water, trampling, weeds, soil difference, harvesting or cloud shadow. NDVI designates location; the cause must be determined by an on-site investigation.
How often should you look at NDVI?
The goal is not a daily check, but the change emerging from cloud-free, comparable recordings. In active growth, it is worth reviewing the spots and the trend when the new usable satellite image arrives.
Resources and further reading
In Sentinel-2 processing, NDVI is the normalized difference between the red and near-infrared bands; the technical background a Copernicus Sentinel-2 algorithm documentation explains. The satellite signal displayed in Meteon is a calculated estimate, not an on-site measurement or independent herbal diagnosis.
